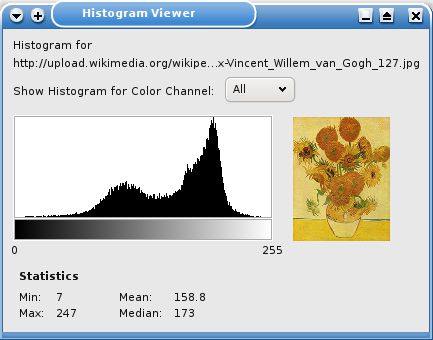
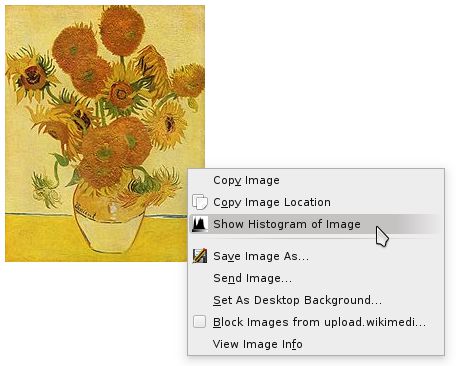
The Histogram Viewer generates the histogram of a selected image. When the user right clicks on an image, the option "Show Histogram of Image" is shown in the context menu. If the user selects this option a new window is opened which shows the histogram of the image.
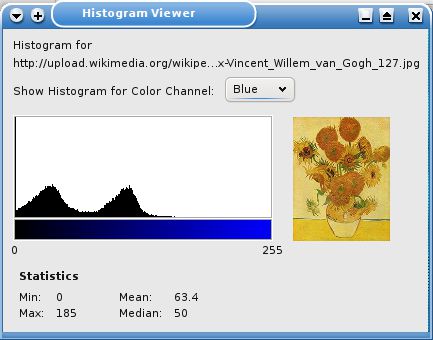
By default the histogram is generated based on the sum of all 3 RGB color channels. Additionally the histogram for each of the 3 color channels can be shown. Some statistics about the histogram are also shown.
Features
* Grayscale histogram
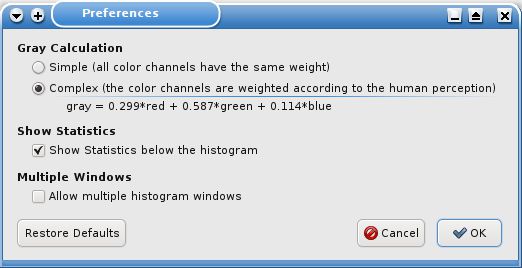
* Option to select the way the grayscale histogram is calculated
* all color channels have the same weight
* the color channels are weighted according to the human perception (gray = 0.299*red + 0.587*green + 0.114*blue)
* shows histograms for each color channel
* shows statistics about the histogram: min, max, mean, median
* optional hiding of the statistics
* shows the individual value and its number of occurrences, when the user moves the mouse over the histogram
 Install
- License: Mozilla Public License 1.1
- Weekly downloads: 1
- Average daily users: 270
- Rating: 4.6667/5 of 3 ratings
- Created: 2008-09-04 11:58:40
- Last updated: 2018-03-02 10:20:07
- Homepage: http://www.davidfichtmueller.de/histogramviewer-en.html
- Support site and email
- Donate
- Orig: https://addons.mozilla.org/en-US/firefox/addon/histogram-viewer/
- API: histogramviewer@davidfichtmueller.de